In the fast-paced world of cryptocurrency trading, it’s important to have effective tools and strategies at your disposal. One such tool is technical analysis, which can help you make informed decisions based on historical price data and crypto market trends. This guide will explore the fundamentals of crypto technical analysis and how you can use it to enhance your crypto trading skills.
What is Technical Analysis?
Technical analysis is a method of evaluating financial markets and assets by analysing historical price and volume data. It focuses on identifying patterns, trends, and indicators that can provide insights into future price movements. By studying charts and employing various technical indicators, traders aim to make predictions about the direction and timing of market movements.
How is Technical Analysis Helpful?
Technical analysis offers several benefits to crypto traders:
- Identifying trends: Technical analysis helps traders identify trends in the market, whether they are bullish (upward), bearish (downward), or ranging (sideways). This information can be valuable for making informed trading decisions.
- Entry and exit Points: By studying market price patterns and support/resistance levels, technical analysis can assist in determining optimal entry and exit points for trades. This can improve the timing of your transactions and potentially increase profits.
- Risk management: Technical analysis tools provide insights into the potential risk associated with a trade. By setting stop-loss orders and understanding risk-reward ratios, traders can manage their risk effectively and protect their capital.
- Confirmation of fundamental analysis: While fundamental analysis focuses on evaluating the intrinsic value of an asset, technical analysis can be used to confirm or validate the assumptions made based on fundamental analysis. This combination can provide a more comprehensive view of the market.
What is the Difference Between Technical Analysis and Fundamental Analysis?
Fundamental analysis involves evaluating the intrinsic value of an asset by analysing factors such as the project’s team, technology, market demand, and competition. On the other hand, technical analysis focuses solely on historical price and volume data, disregarding fundamental factors. While fundamental analysis aims to determine the long-term value of an asset, technical analysis is more concerned with short-term price movements and trends.
In practice, traders often use a combination of both approaches to gain a more comprehensive understanding of the market and make informed trading decisions.
Understanding Candlestick Charts
Candlestick charts can initially appear overwhelming due to the abundance of information they convey. However, with a grasp of the key aspects, reading them becomes relatively straightforward. Let’s explore the essential elements of candlestick charts:
Colour of the Candlestick
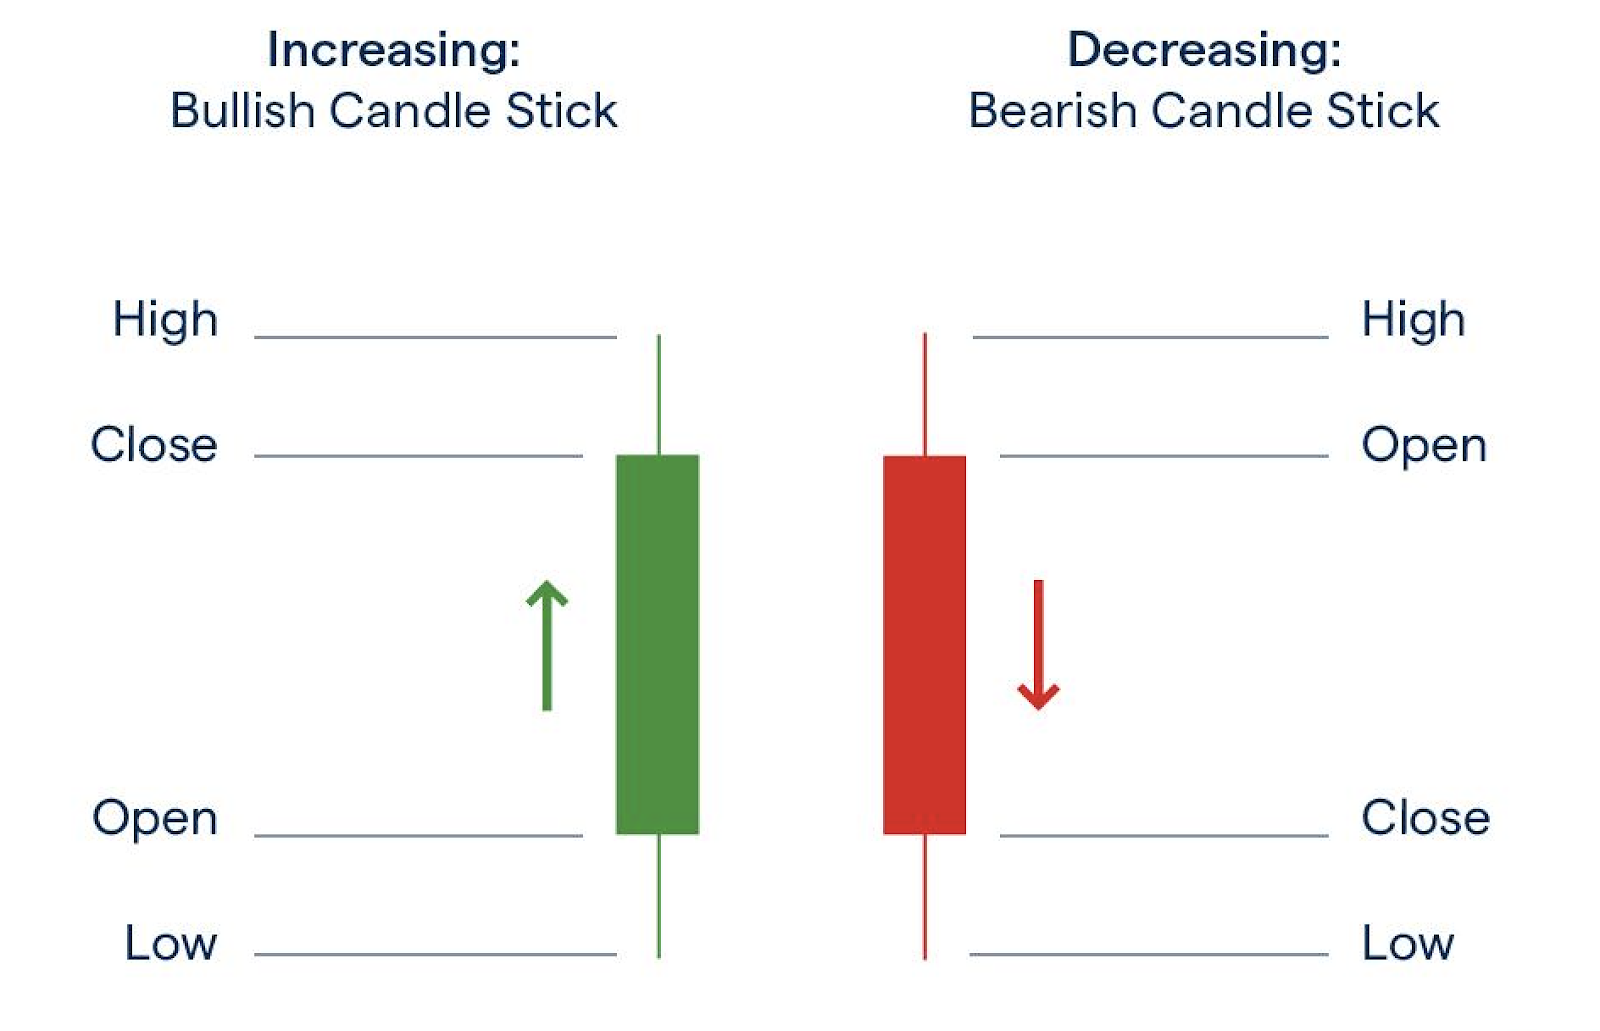
The body of each candlestick is typically coloured green or red. Green indicates a positive price movement during the specific period, while red signifies a negative price movement. It’s worth noting tradition Japanese candlestick charts were black and white, but modern day traders tedn to prefer red and green candles.
Time Interval
Each candlestick represents a distinct time period or trading interval. Although the default setting is often one day, candlestick charts allow for various time intervals. Lower timeframes, such as one-minute, five-minute, or 15-minute charts, are effective for day trading, providing detailed information. In contrast, higher intervals like one day, one week, or one month are better suited for long-term trading strategies. Some traders even use a combination of different timeframes to optimise their analysis.
Open and Close
The body of a candlestick provides information about the opening and closing prices of an asset within the specific time interval. In a green candle, the lower edge of the body represents the opening price, and the upper edge signifies the closing price. Conversely, in a red candle, the upper edge indicates the opening price, and the lower edge represents the closing price. Observing the alignment between the open of a red candle and the close of the preceding green candle is noteworthy.
High and Low
The wick or shadow of a candlestick displays the highest and lowest prices traded for an asset during the given time interval. The top of the wick represents the highest price reached, while the bottom of the wick indicates the lowest price.
By understanding these components, you can decipher the valuable information conveyed by candlestick charts and apply it to your crypto trading decisions.
The basics of of technical analysis
Trading Volume
Trading volume is a crucial metric that can be observed on a cryptocurrency price chart. Typically displayed in columns along the bottom of the chart, trading volume provides important information about market activity.
The chart below shows the trading volume bars circled in blue below the price chart.
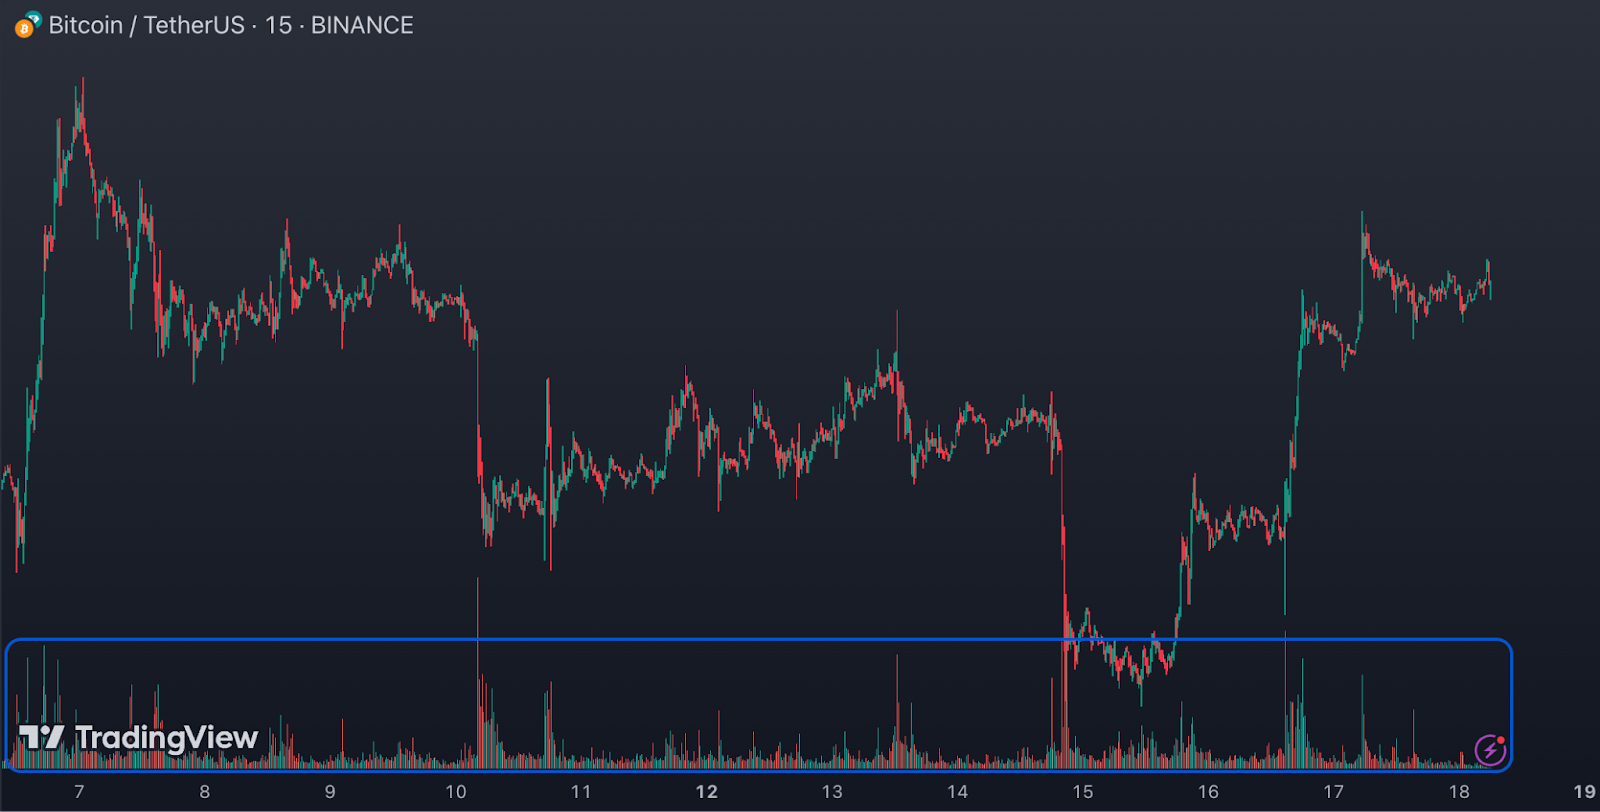
Height and Color of Volume Bars
Each column’s height represents the level of trading volume, while the colour of the bars indicates buying or selling pressure. Green volume bars signify increased interest and buying pressure, indicating a positive sentiment. Conversely, red volume bars indicate decreased interest and selling pressure, suggesting a negative sentiment.
Volume and Price Momentum
Volume can offer insights into the momentum of price movements. High volume accompanied by an increase in price may indicate significant momentum in a price swing or the continuation of an upward trend. Traders often combine volume analysis with candlestick patterns, such as observing a long wick at the top of a candlestick, to identify potential trend reversals or exit points.
Low trade volume, on the other hand, may indicate a lack of continuation in the current price trend, whether it is upward or downward. Sudden spikes in volume may coincide with major announcements or news updates, often preceding significant price changes.
Trend Lines
Trend lines are lines drawn on charts that connect relevant data points and serve as visual aids to better understand market trends and price movements, making them one of the fundamental tools in technical analysis.
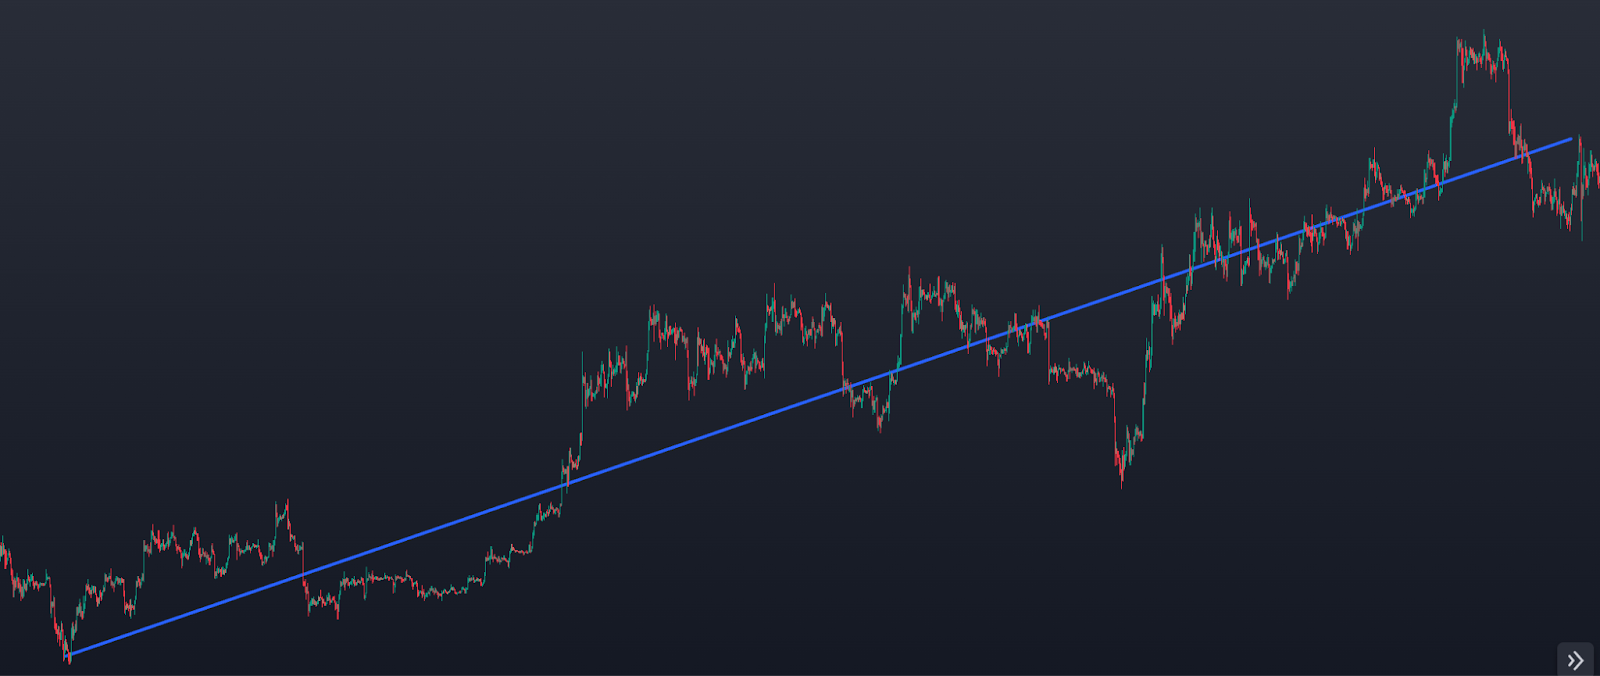
Uptrend and Downtrend Lines
Trend lines can be categorised into two types: uptrend lines and downtrend lines. Uptrend lines are drawn from lower to higher chart positions, indicating a rising price trend. Conversely, downtrend lines are drawn from higher to lower positions, indicating a declining price trend.
Both uptrend and downtrend lines are used to identify points where the price of an asset has tested a trend and returned to it. Trend line-based technical analysis aims to forecast future market movements by extending these lines. When an upward trend line is observed, it signifies growing demand and reduced supply, indicating a surge in buying pressure. Conversely, a downward trend line suggests a decline in price caused by a surplus supply compared to demand. Additionally, trend lines play a pivotal role in identifying support and resistance levels, aiding in market analysis.
Support and Resistance Levels
Support and resistance levels highlight specific data points on a price chart where the price finds difficulty breaking through. Support levels represent a floor where the price bounces upward, while resistance levels act as a ceiling where the price bounces downward.
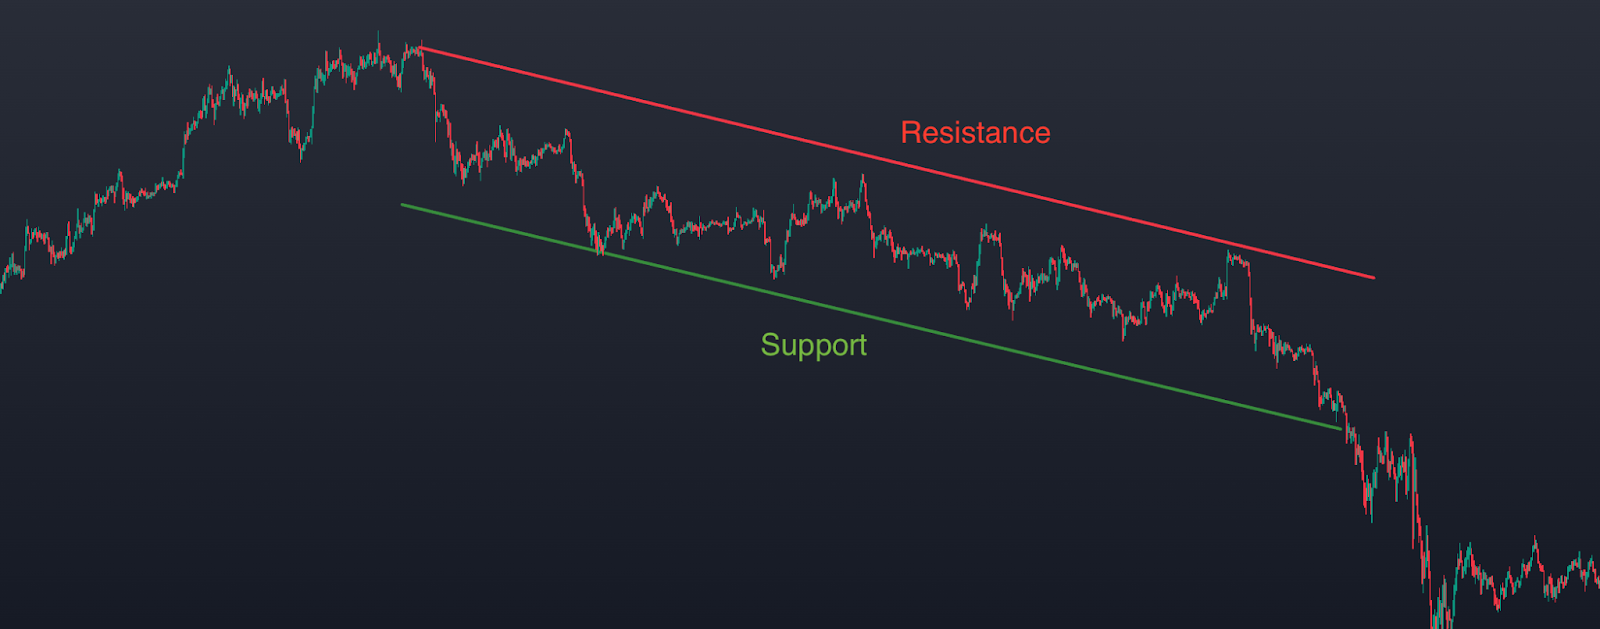
Market Psychology and Key Price Points
Traders and investors use support and resistance levels to identify key price points that have seen increased trading activity and market interest in the past. Market psychology plays a significant role in the placement of these levels, as many traders take note of the same support and resistance levels, leading to market changes and increased liquidity.
Accurately identifying support and resistance levels can provide trading opportunities. Approaching a support level may signal a buying opportunity, while approaching a resistance level may indicate a potential selling opportunity. If the price breaks through a support or resistance level and continues in the direction of the trend, it may present another opportunity to buy or sell, depending on the trend’s direction.
Moving Averages
When it comes to technical analysis in cryptocurrency trading, traders and investors utilise various metrics and indicators to identify and predict market trends. While checking candlestick trends, support and resistance levels, and volume can provide a general understanding of the current market, it is crucial to consider a broader range of information to develop robust trading strategies.
Moving averages offer a higher level of insight by revealing trends over longer time frames, such as weeks or months. The two commonly used types of moving averages are the simple moving average (SMA) and the exponential moving average (EMA).
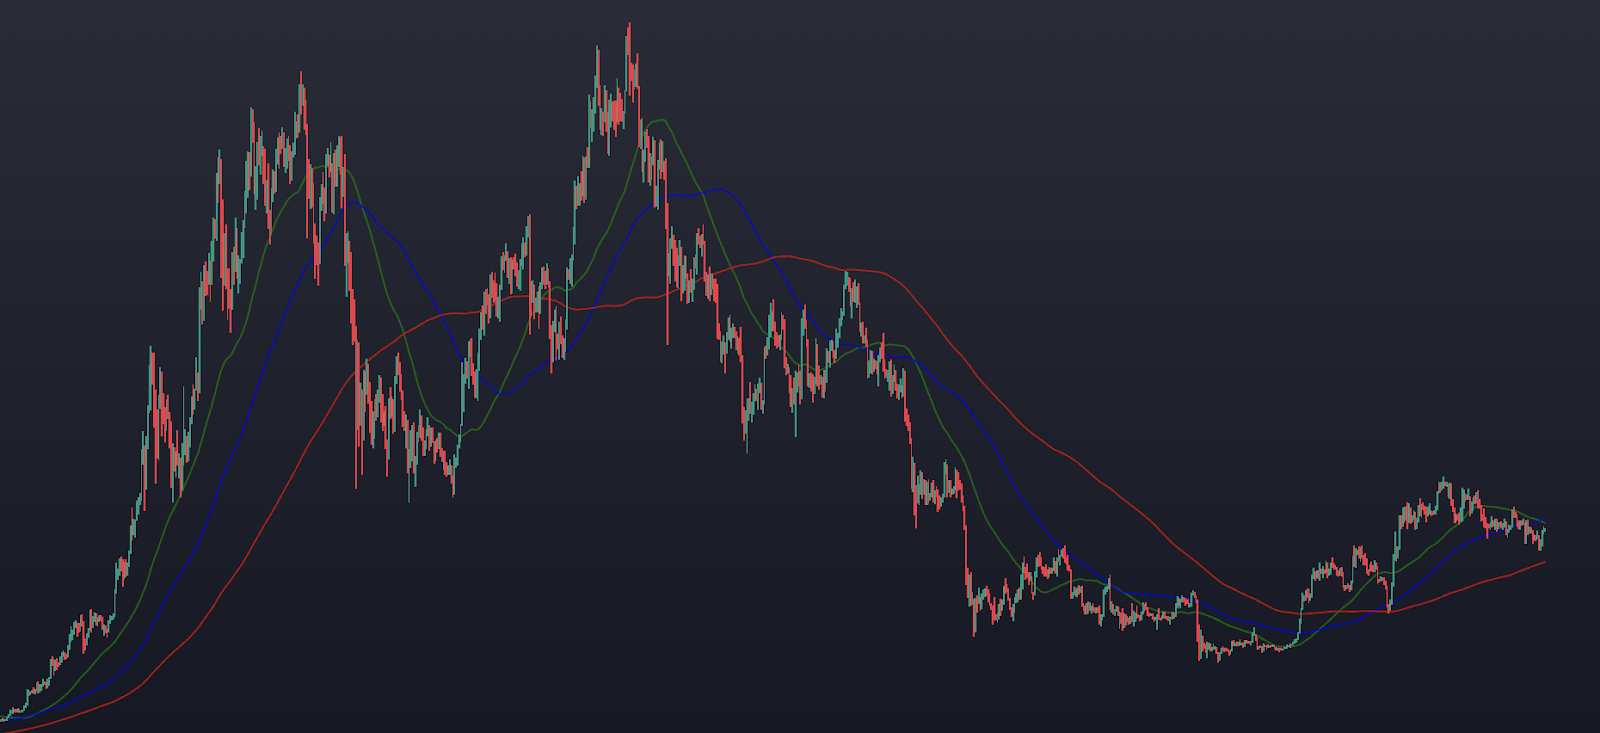
Simple Moving Average (SMA)
The simple moving average calculates the average closing price of an asset over a specific period of time. For example, a seven-day SMA fluctuates across a chart due to the daily changes in the closing price. This is why it is referred to as a moving average. The SMA provides historical context within a market, enabling traders to filter out short-term volatility and gain a deeper understanding of current market trends.
Tip: On charts, a simple moving average is often represented as SMA(X) or MA(X), where X indicates the number of periods considered to calculate the average. These periods can refer to weeks, days, hours, or other time intervals.
Exponential Moving Average (EMA)
The exponential moving average is a slightly more complex indicator. Rather than calculating the average close price over a fixed number of days, treating each day’s closing price with equal importance, the EMA assigns greater weight to closing prices closer to the current day.
When calculating the EMA, the most recent day receives more weight in the calculation than the preceding day, while the first day in the time period has the least weight.
Moving averages become significant when determining resistance levels. If the daily closing price of an asset falls below the moving average, it could indicate a resistance level, suggesting that traders are selling at that specific point. Conversely, a daily closing price that surpasses the moving average could indicate a bullish market sentiment.
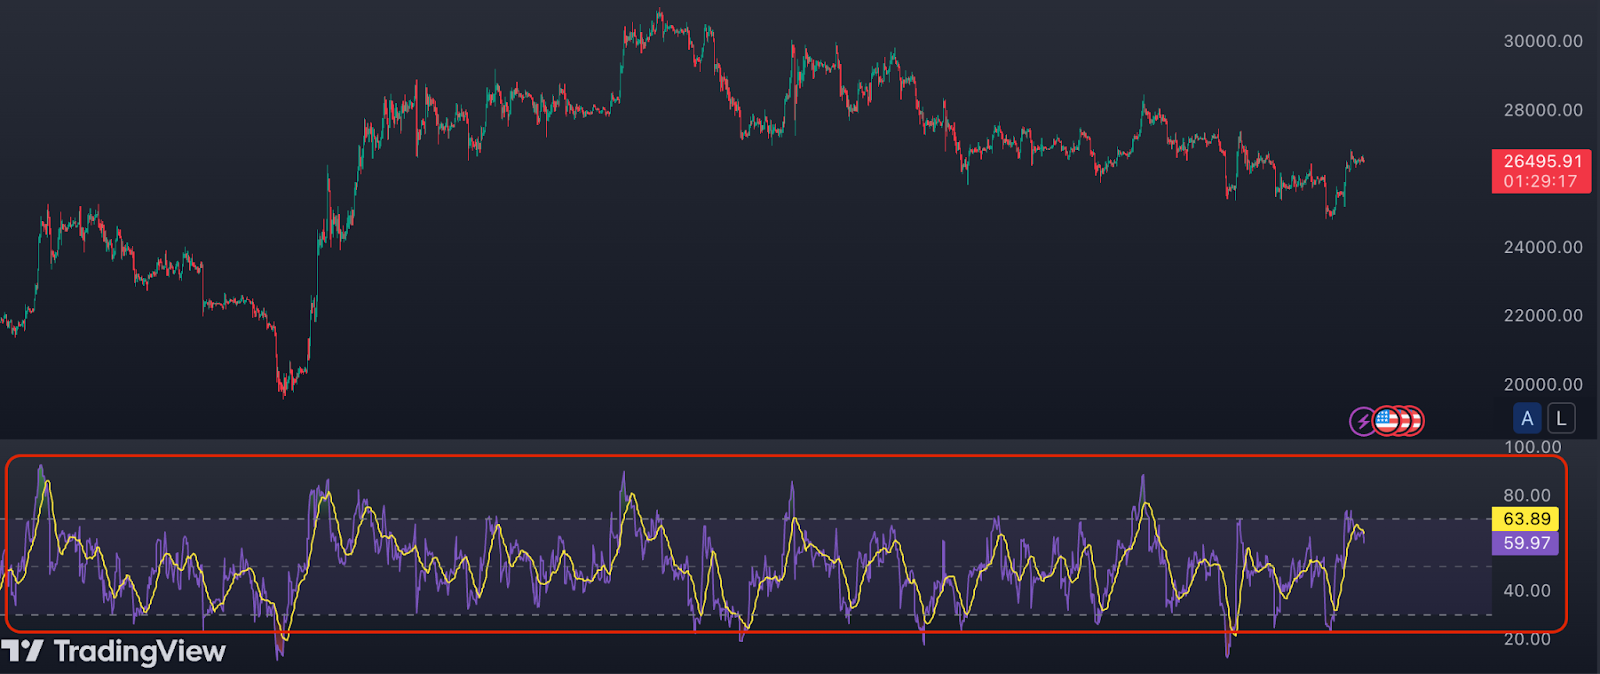
Relative Strength Index (RSI)
The Relative Strength Index (RSI) is a widely used tool for analysing market conditions. It assigns a score ranging from 0 to 100, where a score below 30 suggests oversold conditions for a coin, while a score above 70 indicates overbought territory. RSI has proven to be a valuable indicator for assessing market trends historically.
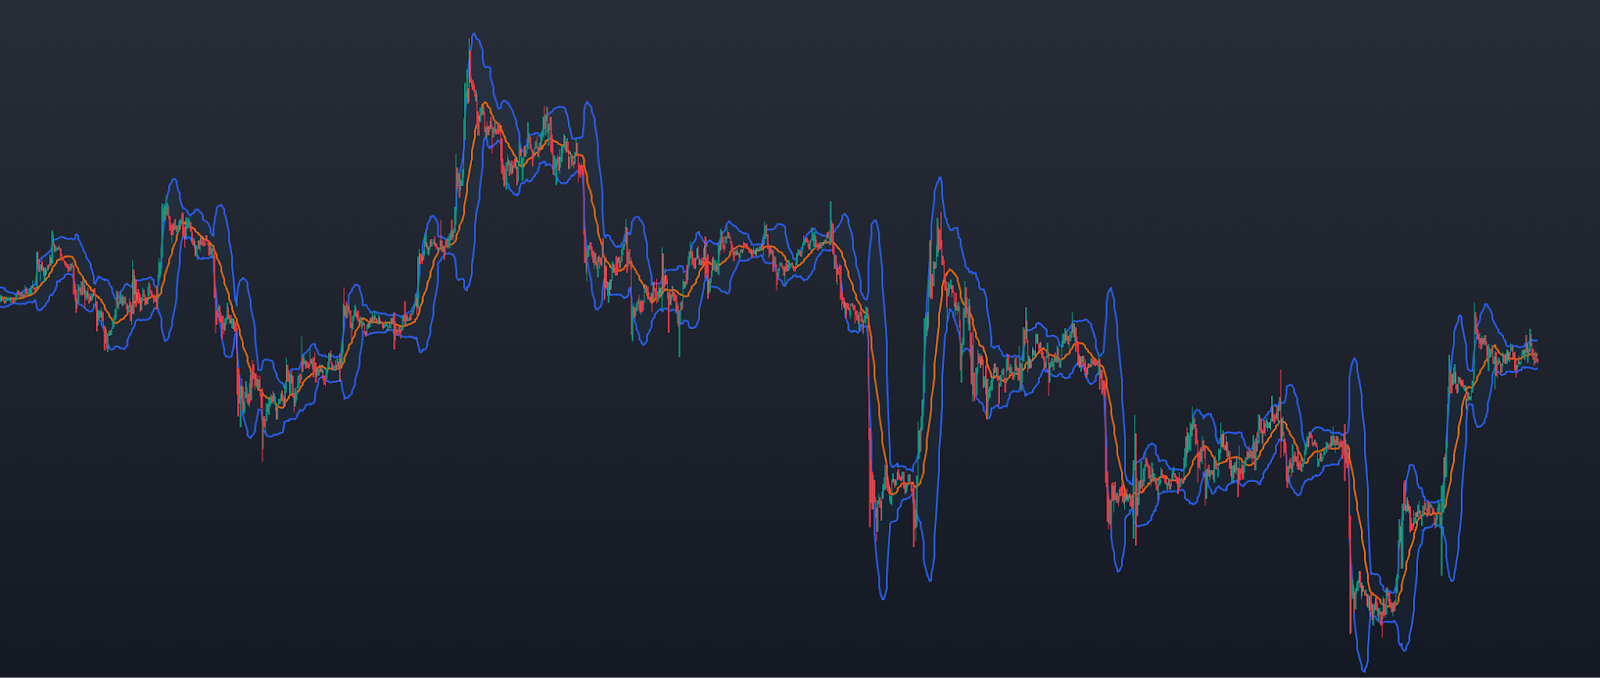
Other Technical Analysis Indicators
There are additional, more complex technical analysis (TA) indicators available, such as Bollinger Bands. Bollinger Bands consist of two lateral bands surrounding a moving average and are used to measure market volatility. Similar to the RSI, they can help identify potentially overbought or oversold market conditions.
When price dips below the lower band, this can indicate a cryptocurrency is oversold and when price increases above the higher band, it could indicate that price if overbought.
What About Custom Indicators?
Custom indicators in cryptocurrency trading are personalised technical analysis tools that utilise algorithms and combine multiple indicators such as RSI, Bollinger Bands, and support and resistance levels. These indicators are developed by traders to suit their specific trading style and insights. By leveraging custom indicators, traders can receive signals that may not be available with standard indicators, giving them a competitive advantage in identifying market trends and making profitable trading decisions.
The Market Mapper is a custom indicator developed by the Coinware team that generates simple buy and sell signals using sophisticated algorithms and technical analysis. Check out some of the Market Mapper results here or watch it in action below.
Using TradingView for Technical Analysis
TradingView allows users to access real-time market data from various financial markets, including stocks, cryptocurrencies, forex, and commodities. The platform offers interactive charts with a variety of technical indicators and drawing tools that can be customised to fit individual trading strategies. Traders can apply indicators such as moving averages, Bollinger Bands, RSI, MACD, and many more to analyse price movements and identify potential entry and exit points.
Additionally, TradingView enables users to create and share their own custom indicators, strategies, and scripts. This opens up opportunities for collaboration and knowledge-sharing within the trading community. Traders can also access a vast library of pre-built indicators and strategies created by other users, further expanding their analytical capabilities.
With its user-friendly interface and extensive charting capabilities, TradingView empowers traders to perform in-depth technical analysis, spot patterns and trends, and make informed trading decisions. It serves as a comprehensive platform for both novice and experienced traders to gain valuable insights into the financial markets.TradingView offers users a demo account and you can set up alerts to ensure you never miss a trade.